Shatha Khalil *
The Central Bureau of Statistics in the Iraqi Ministry of Planning, the Statistics Authority of the Kurdistan Region and the World Bank carried out a survey and evaluation of poverty in Iraq in 2018, in cooperation with the Executive Administration of Poverty Reduction Strategy, in order to obtain updated socio-economic indicators. And the sample size was based on 8640 households in all governorates of Iraq by (360) families in each province, except Baghdad and the Kurdistan region which has reached (900) families.
It was found that the current Iraqi economic situation affected by the crises, which affected the economy of the country and thus affecting the living situation of Iraqi families.
The focus was on economic and social indicators to reach the real situation of Iraqi households as follows:
• The spending : The results showed that the structure of household expenditure on consumer goods and services has changed compared to the years 2012-2014, 2018/2017.
• Personal status: The current economic situation of families:
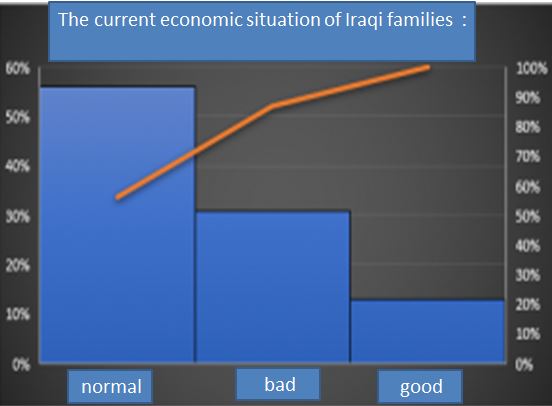
• Compared with January of 2014 (44%) worse, and (40%) as it was before 2014, (16) % better.
The proportion of families who have not been subjected to trauma (63.7%).
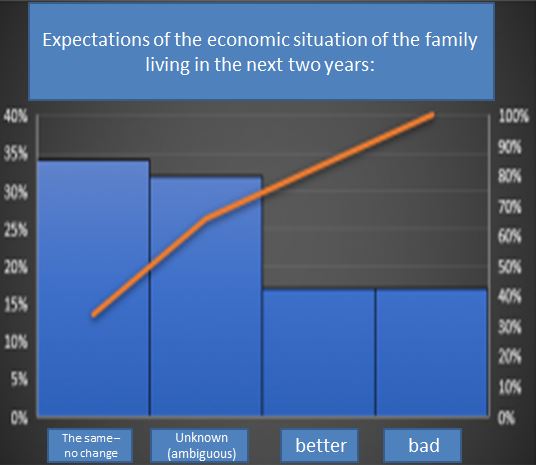
The expectations for the economic situation are that around 17% will be worse, 34% expect the same that it does not change, 17% expect it to be better and 32% expect a mysterious future.
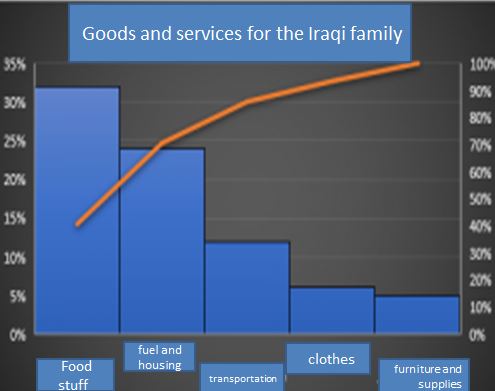
• Goods and services: The food group ranked first (32%), followed by fuel, housing and lighting (24%) , transport ranked the third (12.1%), clothing and shoes ranked the fourth (6.4%), and then furniture and household appliances at the fifth rank ( 5.3% ) for the year 2017-2018.
• Average household expenditure (1276) dinars per month at paid prices and (1503) dinars per month at market prices.
The results of total household expenditure indicate that:
– Households that spend less than one million dinars per month represent 31%.
– Households spend between one million and less than two million dinars per month, representing 48.2%.
– Households spend between two million and less than three million per month representing 14.6%.
– Households that spend three million dinars or more per month represent 5.7%
• Average monthly household expenditure at paid prices:
Average at paid price:
The average monthly household expenditure was calculated at market prices after evaluating the ration card items at its prices in the commercial markets and evaluating rents for all types of housing according to the prevailing rent rates for the corresponding housing.
Average per capita monthly expenditure amounted (212.6) thousand dinars per month at the paid prices and (253.3) thousand dinars per month at market prices, and the results of the total expenditure per capita shows that:
– (45.7) of individuals spend less than 200 thousand dinars per month
– (26.8) of individuals who spend between 200 thousand to less than 300 thousand dinars per month
– (14) individuals who spend between 300 to less than 400 thousand dinars per month
– (13.3) of the individuals who spend 400 thousand dinars or more per month .
Demographic indicators:
The average size of the family in Iraq is six individuals, 5.9 in urban areas and 6.5 in rural areas. The age distribution of individuals indicates that the Iraqi society is a young society, 38.9% of whom are under 15 years of age as the percentage of gender amounted by (102.4 ) of males and the rate was low in Urban areas by ( 102.0 %) to rural areas (104.7).
The dependency ratio (74%) and the rural dependency rate (84%) were more than urban (71%).
Housing:
The results showed that (72%) of the households, or nearly three out of every four families, have dwellings.
Waste disposal for families: 53% by the municipality, 25% thrown outside the housing unit, 8% put in designated containers, and 13% disposed by burning.
98% of households use liquid gas in the cooking process.
The rate of hours of electricity supply from the public network was (17) hours per day, and the processing of electricity from the common generator amounted to (6) hours per day.
92% of households connect their residential units to the public water network.
11% of households in rural areas use water from a river / canal / stream /, and household sanitation: 35% public network, 58% septic tank and 4% covered drain.
(69%) of households have sufficient water supply, while the remaining households suffer from poor water supply. 97% of these households use water storage in domestic tanks to treat water scarcity.
Durable Goods:
(41.7%) of households own a car, 15.9% of households own a personal computer.
10.9% of households own IPAD and 78.5% of households own smart phones.
Education and Culture: The results indicate that 87% of individuals over the age of 10 are literate, 91.9% are males and 82.1% are females.
Net enrollment rate in elementary stage was 92.5%, middle stage (56.8%) and secondary stage (29.6%). There were differences between males and females according to geographical divisions and residential groups.
The results of the survey showed that the main reason for not attending school is the lack of schools near their residential areas (30.3%) and there are social reasons for females (11.2%).
Manpower
The rate of economic activity for individuals aged 15 years and over was (42.8%) with a difference in the ratio between men (72.7%) and women (13%). The unemployment rate for adults (15 years and over) was 13.8%.
Unemployment rates for the age group (15-24) rose by 27.5%.
Half of the wage earners work in the government sector; 90% of the working women work in the public sector.
Donations and assistance:
(25.4%) of the households have a pension, 95% of the households received a ration, 7.5% received cash assistance from the government, and 4% received gifts and assistance from civil society organizations.
98% of the families indicated that the ration is important for them.
Trauma: The results for families who have been traumatized indicate that they were subject to the violence, insecurity, death, illness or injury of a family member, loss of ration, forced displacement 17.2%, 16.9%, 16.4%, 15.9%, 15.5% 13.7% and 10.2%, respectively.
Economic Studies Unit
Rawabet Center for Research and Strategic Studies